
Quick exploration of a long-term insect collection dataset from Copenhagen
Earlier this week, I was scrolling through Kaggle to see what types of biology datasets were available there and ran across this one that seemed interesting: Insect Light Trap, a huge 18-year insect collection effort done by the Zoological Museum of the University of Copenhagen, between 1992 and 2009. The work was published back in 2015 and is open-access, with very detailed analyses on the diversity of groups found, correlating observations to time of year (big peak in summer, very few observations in winter, as I’d expect for northern Europe) and temperature/climate change. Do check out the paper if you’d like a deeper look into those aspects, because I’m just going to have a quick look at the dataset itself and see what kind of fun stuff I find in there.
Getting the data
The first glance at Kaggle was great, it seemed like a nicely-formatted .csv with columns for various taxonomic levels, counts for each species, and collection start/end dates! Should make for a nice smooth start…
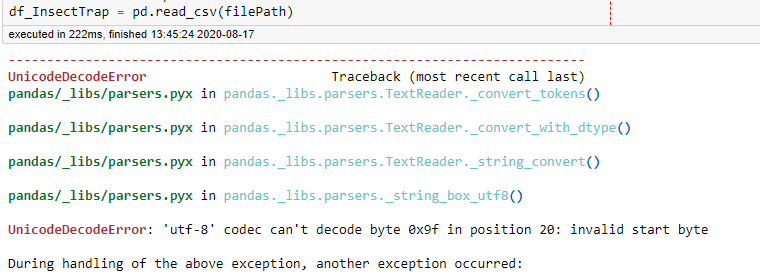
Or maybe not… that mention of utf-8 means there must be some weird character in the file that pandas is not happy with! To confirm that, I made a new .csv with just the first 5 lines of the full dataset and that loaded just fine, so the thing that’s causing the problem is bound to be somewhere in the remaining 44,083 lines… yay! I’m trying to be smart in how I do these analyses, so that rules out scrolling down til I spot something weird.
I went back to Kaggle to redownload the file, holding onto the faint hope that something got messed up in the download. But no, redownloaded file produces the same error. I did notice that Kaggle has an option to export a dataset to Google Sheets, so I could use the GSuite option to export to .csv and hopefully that should generate a file that pandas is happy to read!
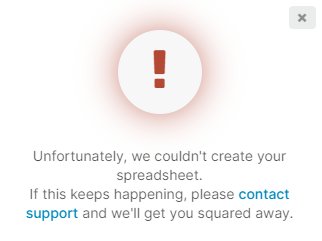
After a good 30 seconds watching a spinny wheel that I hoped meant my data was being moved to the bowels of Google, I got an angry red exclamation mark and a useless error message! No, I’m not going to contact support, I’d rather scroll through the 40k+ lines than wait days and days for an answer.
I was about to start writing up the simple code to loop over the entire file and just build the dataframe myself, but then some lucky googling got me to a StackOverflow post that looked hopeful. Somebody mentioned trouble reading a .csv with a similar character encoding error and that adding the flag encoding = "latin1" to their .read_csv() call solved their issue! I had no idea whether that was the character set in my file* but I figured “Why not try?”. Magically that worked, everything got loaded into a dataframe with no issues and I still have no clue what oddball character in the file was producing that error… some questions are best left unanswered!
Exploring the data
After getting everything loaded, I started looking at the higher level numbers in the dataset: number of different orders and families (higher taxonomic groupings), number of observations, and number of insects collected per observation.
All 44088 rows in the table were from only two insect orders: Coleoptera (beetles) and Lepidoptera (butterflies/moths). While these two groups are extremely diverse and also very common, I would have expected others to appear! Looking back at how the methods section of the text is worded, it seems that they excluded any observation not from these two orders. These two groups are the insects that do seem to be attracted to lights most often anyway, and the convenience of not needing to consult an additional expert every time an oddball animal from another order appeared probably also helped… From an outsider’s view, identifying an animal may seem like easy work, but it takes years of practice to be able to do it well!**
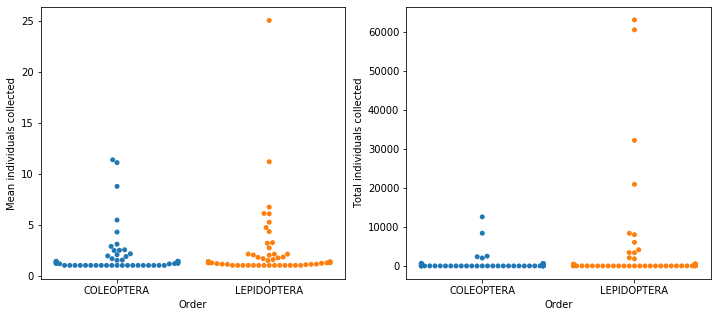
Jumping up to families, there’s 104 different families and exactly 52 for each order!*** Adding up all the counts for individual animals collected, they had just over 250k insects, just under 6 counts per row in the table. But are these observations evenly distributed enough for a mean to have any meaning? I took this mean for each individual family and the vast majority had values close to 1, but 4 had values over 10 and the highest was 25 (figure below, left panel). From this, it’s already clear that there’s a big heterogeneity in the frequency for each family. I made another plot with the sum of all individuals for each family and a similar pattern appeared, but with an even bigger dominance of the most observed families (figure below, right panel)
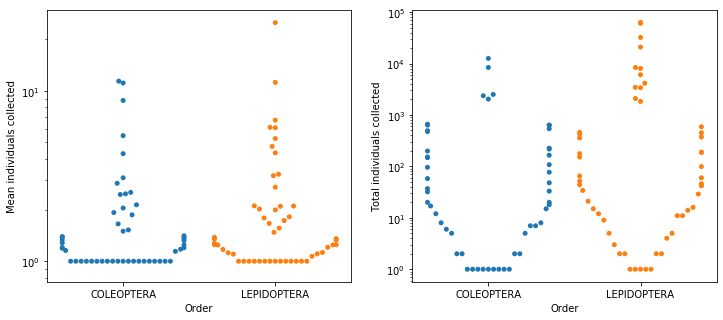
Repeating those plots with a log-scale y axis makes the lower end of the scale a little less bunched up and it’s clear that there is a lot of variation at that range, as well (figure below).
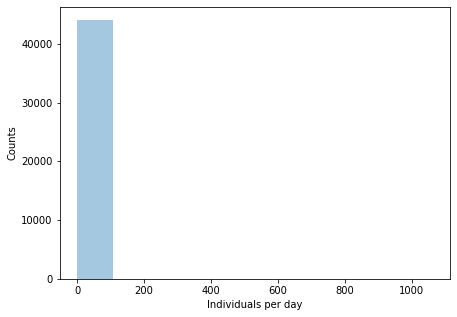
Let’s try looking at these same numbers in histograms, to get a better idea of how they’re distributed than we can get from looking at bunched up points. In the first one on the left, most of the points land on the first bin and then a few stragglers are scattered all the way to 60k individuals. Cutting off the plot below 10k counts dos spread them a bit, but the first bin still has over 80% of the families. Zooming further in, to the families below 1k counts, it does start filling up the x-axis a bit more and the first bin only has about 60% of the values. This does seem like one of those long-tailed distributions that appear frequently in biology, like a power law, where the the vast majority of observations are clustered at very low values and a tiny number of groups have huge values.
This was a fun dataset to dig into for a little bit and learn a few more of the quirks of pandas to deal with weird file formats, and also get practice with the kinds of transformations on the data that can lead to non-obvious insights. But it’s not quite the type of dataset I was hoping to find and then properly dig my claws into it. For my next post, I’ll have something that I can start going into in more depth.
The notebook I used for these analysis is up on one of my public repos and the original paper has proper in-depth analyses into the types of species they collected and how they varied over the years and also within each year.
Footnotes
* Atom just shows me “UTF-8” when I open it and I couldn’t think of another way to check the character encoding of a text file.
** Identifying species is hard enough for bright, flashy and relatively big birds, but I can say from personal experience in undergrad that anything smaller than a centimetre or two can be an absolute pain to look at if you need to pick out tiny anatomical differences!
*** Very likely just a big coincidence, but our brains love to see unlikely patterns like this and immediately start searching for some meaning.