
First look at the data from my garden compost pile (AKA, how simple data can be misleading!)
As the first real post in this blog, we’re going to look at the longest-running personal project that I have right now: the compost pile that I started in the garden about 4 months ago to try to improve the fertility of the soil.
I had tried growing some courgettes/zucchinis* in the garden and they kept drying out or dying of apparent fungal infections. Then I started following the tweets from a gardener in the US (@BuildSoil) who talks a lot about composting as a way to improve soil quality and prevent a lot of these problems, so figured I could give it a try!
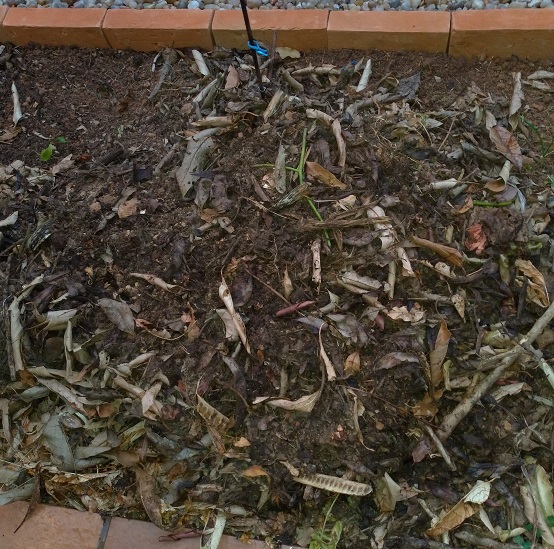
Since around April, every food scrap that is not meat or prepared food (fruit/veggie peels, egg shells, stalks, etc) has been going into piles like in the photo below, along with lawn clippings and dry leaves.
Then, I just make sure to keep the pile moist and turn it 1-2 times a week. Every month or so, I split the pile, move the new half elsewhere, and then just add new scraps into the new pile. After another couple of weeks, the old pile is ready to be used as soil for planting. The new plants are still not perfect, but they certainly look better than they did before I started this whole process!
All that was just to introduce the actual topic of the post, which is the data I started collecting in late June by weighing the scrap inputs that went to the compost pile. My initial reason to collect this data was to try to later produce some estimate of the amount of carbon that I’m putting back into the soil. But, not long after starting to record the data, I started thinking whether there were any interesting patterns that I could pick out from this data, like whether it would be possible to detect days that I prepare more elaborate meals by higher amounts of veggie peels going into the pile on those days.
Data!!
So I set up a very elaborate data recording system: a whiteboard stuck to a door, so I could write down the amount of material going in each day! I also wrote next to each entry whether I cooked a meal that day or not, a simple boolean variable that I could maybe use to train some sort of classifier from the weight data labeled with those 1s and 0s.
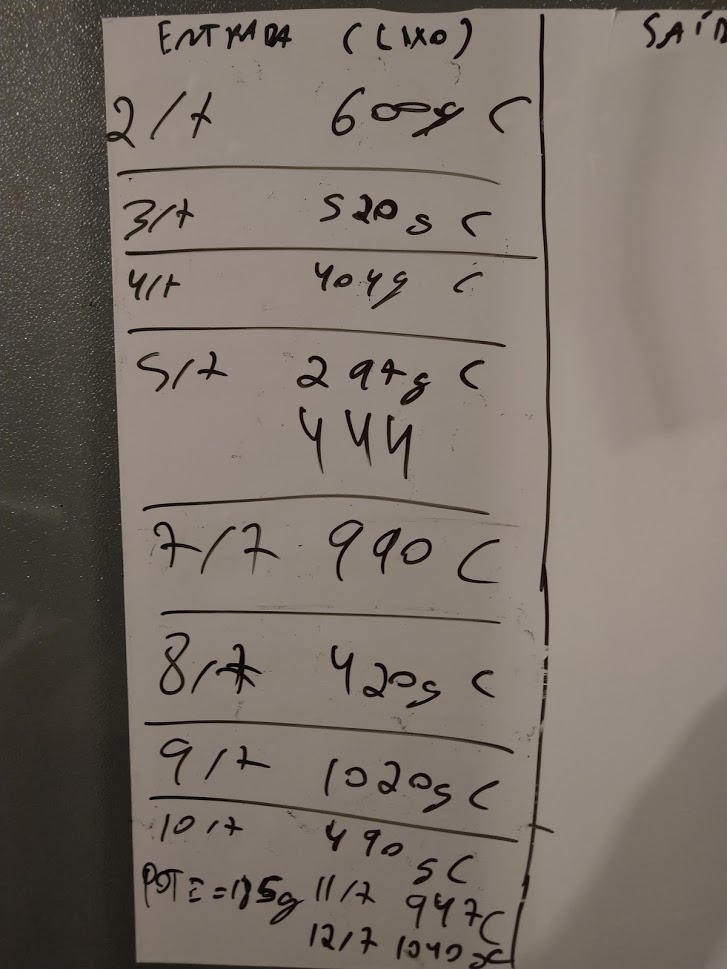
If you can decipher some of my hieroglyphs, you’ll see that some days don’t have recorded entries. Was no food scrap produced at all on those days? Maybe that did happen on a few days, but certainly not all of them! What happened on most of the days with no entries is that I was either too busy to bother taking out the scraps that day and just added it to the amount for the next day, or I wasn’t at home at all. So that’s already one confounding factor to keep in mind when we start looking at the actual data!
Which is exactly what we’re going to start doing! I collected about 1.5 months of data into a .csv*** and loaded it into a Jupyter notebook(uploaded here if you’d like to have a look at how the sausage gets made) to make some plots.
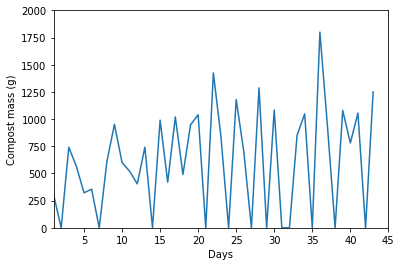
That’s looking a bit noisy because of all the days with zero Compost Mass plotted, when I did not take the scraps out to the garden. Maybe a sliding window average will help clean it up a bit?
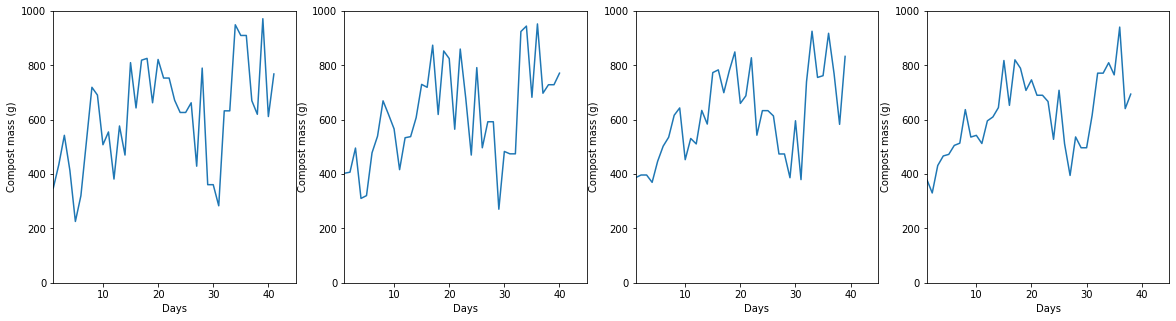 (Same data as above, but the y axes are plotted as the sliding average over 3, 4, 5, 6 days from left to right)
These look way better! It sort of looks like there was an increasing trend for Compost Mass from day 0 to the most recent data points? It’s possible, but I think it’s more likely to be another artifact caused by the human behind data collection!
From day 0, I was collecting the scraps in a small-ish bowl, which meant that some days I had to make more than one (extremely inconvenient, 30-second) trip out of the kitchen and into the garden. Also, whenever the bowl was full, it was very tempting to avoid the additional trip to the compost tile by just throwing a few tiny, insignificant bits of scrap into the normal rubbish bin. Around day 15**** I switched the bowl for a larger container that can easily hold the total scrap for 2 days, allowing for a more convenient composting schedule.
Now that I see the data, I guess the bits that sometimes went to normal rubbish weren’t so insignificant… If we just look at the sliding average past day 15 or so, the trendline there would probably be parallel to the x-axis. I’ll just keep it as an eyeballed trend for now and save this additional analysis for a future revisit of this ongoing dataset, with more data points. This post is already way longer than I envisioned it!
Now let’s see whether there was any noticeable difference between the two states of my boolean variable on whether I cooked that day or not:
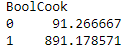
That’s the mean of CompostMass for data points with 0 (no cooking that day) or 1 (there was cooking that day) states of the BoolCook variable. That looks like a massive difference between days with and without cooking, right?? It looks like a great variable to use to try to train some type of classification model!
I may be a just a biologist, but I do know that blindly trusting a mean is a risky bet! Let’s have a look at the how these two sets are distributed, to find out whether it makes sense to take their means:
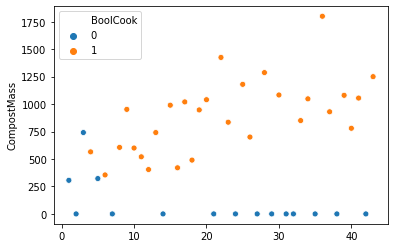
From this plot, it’s pretty obvious that the mean Compost Mass for days where BoolCook was 0 is absolutely meaningless! There are only 3 days where Compost Mass was >0 for that group and 12 zero values, because days with no compost to the garden automatically got labeled as 0 on BoolCook, too! Even if I did just take the mean of the 3 non-zero values, it still wouldn’t be a fair comparison since all of those values happened at the very beginning of the time series and after day 7 or so, I labeled every day with compost input as a day in which cooking happened.
Did I really start cooking more often after day 7? Probably not, but my definition of what constitutes a day with cooking did change as time went on. Initially, I was only counting days that I cooked fresh hot food, but then I realised that a good chunk of the material going to compost was actually peels and other leftovers from fresh fruit eating. After a few days with some internal debate whether to label a day as 1/0 on BoolCook, I simply gave up and ended up putting a 1 for every day after day 7 or so that had any compost input. So, it’s not a meaningful signal at all, just a poorly specified variable that contains noise instead of data.
Wrapping up
What can we conclude from all this?
1) We can’t just blindly trust any type of automated analyses on a dataset without exploring it a bit and understanding how it was generated. If I simply received this dataset with no explanation for the 0 compost input days, I could interpret that as a much bigger variability in the amount of scraps produced every day than is visible in the sliding window plots. Since I was actually producing the scraps and taking them out, I can dig up explanations for what we’re seeing on the plots from memory. But relying on memory is definitely not a good way to produce reliable data on anything, which leads to the next point…
2) Humans are fallible/lazy! Of course, I wrote that last statement in the third person to sidestep some of the guilt, but the point remains that an inconvenient/labour intensive data collection process is error-prone and that will have implications on the quality of the dataset.
Would an automated system with a balance that logs straight to a database and a conveyor belt to carry the scraps to the garden help here? Definitely!
Am I going to spend the money and time to build something that complex for this project? Probably not, though I do have plans to some hardware projects down the line… keep an eye out for future posts!
3) Poorly defined categories lead to useless data! More time spent planning would have led me to either define the states of the BoolCook variable in a way that is more internally consistent. Or I simply would have realised that I couldn’t make that distinction, and that it wasn’t worth the effort of recording that information at all. More data is not always a good thing, especially if it leads down analysis dead ends!
Footnotes
* Get ready to deal with my inconsistent use of British and American words/spelling, cos it’s all a mess in my head! I do try to stick to the British forms since it’s what I used most recently, but I’m sure I’ll miss a few here and there**
** Random footnotes are probably going to be frequent too… Side thoughts are a big part of my thought process and I always loved reading the wild footnotes in books like The Mezzanine and the whole Discworld series.
*** By “collecting data into a .csv, read that I took photos of the board when it got full and then typed everything up manually. I don’t think even the best modern image recognition software could reliably decode my awful handwriting!”
**** Of course, the fallible human forgot to record when that switch happened!